
Price Know-How:
Review of 2022 & Outlook for 2023
Written By Mike Boswell - Managing Director, Plastribution Group
Skip to:
2022 Review

Executive Overview
The market in 2022 was dominated by the Russian invasion of Ukraine, which was an event that came as a complete surprise to the whole world in February.
What for Russia, was expected to be a short conflict has subsequently become a long war in which the support for Ukraine from the West has resulted in retaliation from the Russians in the form of energy sanctions. Whether inflation was already becoming an issue in developed economies or not, the spiralling energy costs resulting from the Russian energy supply restrictions has caused significant inflation, with rates typically in and around 10%. Central banks in the US, Europe and the UK then applied significant hikes in base interest rates in an attempt to curb inflation.
Here in the UK, the Bank of England rate has already jumped up 3.4% with more likely to come; albeit the impact of these changes on a generation of consumers who have never experienced more normal borrowing rates is unproven.
In the crude oil and petrochemicals sector, the risk of a global recession far outweighed any initial concerns about the scarcity of oil and gas supply from Russia. Prices fell dramatically from the record highs recorded just before the middle of the year, with the ‘polyolefin’s basket’ price falling some 25% by the end of December.
Energy costs became a key topic both for polymer producers and polymer converters with each sector defined as energy intensive. For polymer converters in the UK, it was commonplace to hear of electricity price increases of up to 400% whenever fixed price deals were up for renewal, however, some of this extreme cost inflation has been offset by falling raw material costs and the possibility of some temporary government support. Polymer producers made some valiant efforts to pass through their energy cost increases, often in the form of surcharges, but these became unhinged by the challenging market dynamics.
Whilst the burgeoning supply of PP and PE from Russia was quickly aborted following the Russian invasion of Ukraine, the combination of diminished demand and revived PE supply from the USA, following constrained supply from that region in 2021, ensured that supply was plentiful. Furthermore, falling East-West shipping costs in H2 enabled the normal movement of plastics to resume on the basis that it is once again economically viable.
Despite the challenges of 2022, the UK plastics sector has once again demonstrated resilience in the face of significant challenges.
UK Economy & Brexit
Subject to confirmation from HM treasury it is likely that the UK economy will have moved into recession, by recording at least two consecutive quarters of negative GDP growth. Many economists predict a short and shallow recession lasting between 12 and 24 months and likely to see annual GDP growth dip into the -1.5% to -2.0% range. The impact on the industrial sector may be less severe, as other sectors such as retail and hospitality bear the brunt of a fall in consumer spending.
One element that is difficult to isolate is the move from ‘just in time’ to ‘just in case’ and back to ‘just in time’. The move to ‘just in case’ resulted in part from Brexit and then was continued as a result of supply chain disruption and abnormal demand during the Covid-19 pandemic. The return to ‘just in time’ is driven by a combination of falling prices and recession; as prices fall there is no financial incentive to keep inventory and companies trend towards cash rather than inventory in times of economic uncertainty. This situation may go some way to explain the very pessimistic outlook being recorded in the UK Manufacturing PMI.
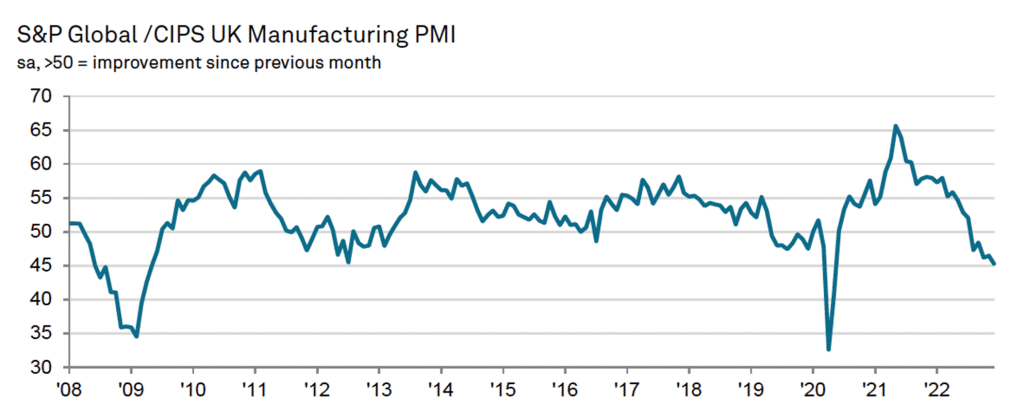

The S&P Global / CIPS UK Manufacturing PMI® published on 3.1.23 included the following commentary
“The seasonally adjusted S&P Global / CIPS UK Manufacturing Purchasing Managers’ Index® (PMI®) fell to a 31-month low of 45.3 in December, down from 46.5 in November but above the earlier flash estimate of 44.7. The PMI has remained below the neutral 50.0 mark for five successive months. Excluding the series lows registered during the first pandemic lockdown, the current PMI reading is one of the weakest since mid-2009. The seasonally adjusted S&P Global / CIPS UK Manufacturing Purchasing Managers’ Index® (PMI®) fell to a 31-month low of 45.3 in December, down from 46.5 in November but above the earlier flash estimate of 44.7.
The PMI has remained below the neutral 50.0 mark for five successive months. Excluding the series lows registered during the first pandemic lockdown, the current PMI reading is one of the weakest since mid-2009.”
Already two years have passed since the UK finally left the EU, and much of the fallout became inextricably combined with the broader impact of the Covid-19 pandemic on the UK and the global economy. The trade agreement made on 31.12.20 removed the imposition of duties on goods manufactured in the EU27 and the UK passing from one to the other. However, the administration has become burdensome as import and export regulations have been more strictly imposed, and the Northern Ireland situation continues to generate controversy.
Political events in the UK caused economic turmoil and in particular, the short stint of service by Liz Truss as Prime Minister and Kwasi Kwarteng as Chancellor of the Exchequer caused untold grief as their ‘mini budget’ was announced. The ensuing reaction from the financial markets enabled a rapid correction and much confidence has now been restored through the appointment of Rishi Sunak.
Nonetheless, international markets remain concerned about the prospects for the UK economy, and hence the continued pressure that is being placed upon the value of the GBP against other leading currencies.
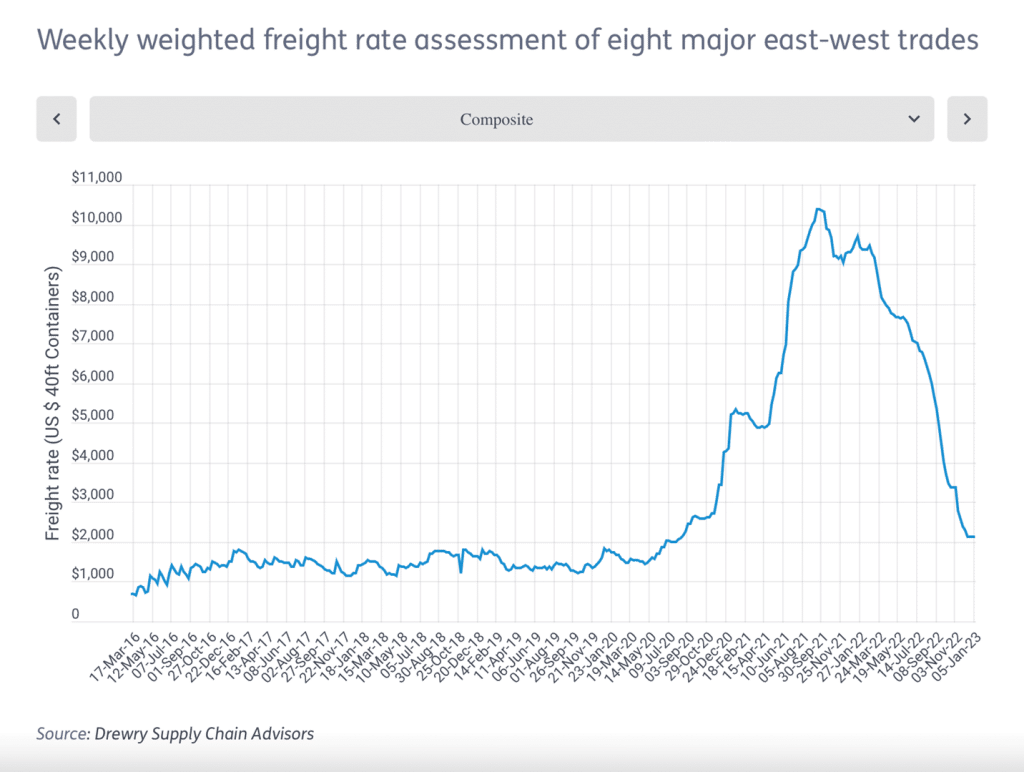
Logistics
As illustrated below, the extreme inflation in East-West container shipping rates peaked in mid-2022, since which time prices have fallen back to near-normal levels.
As illustrated in the table below, high shipping costs in the context of typical polymer prices became prohibitive and effectively isolated Europe from the perspective of importing more competitively priced polymer, where exporters did not have the protection of shipping rates that were contracted.
Shipping Rates
It should be noted that shipping rates within Europe have declined less and this is having an impact on trade within the continent. Finally, it is possible that a similar East-West shipping crisis could recur, as China relaxes its Covid-19 restrictions with the risk that much of the Chinese manufacturing sector is shuttered in an attempt to control the spread of the virus.
Within the UK, the shortage of HGV drivers appears to be less acute, with a combination of more drivers and the economic slowdown both contributing to more availability of resources.
Exchange Rates
Following the invasion of Ukraine by Russia, the USD gained strength as there was a market move to what is perceived to be a safe currency. The negative impact of the UK ‘mini budget’ is evidenced in the September performance, with intra-month GBP: Euro falling well below 1.10, although the predictions of sub-parity against the Euro and USD were never realised. Most recently the USD has weakened as concerns grow about a slowdown in the US economy.
The result of the June 2016 Brexit referendum appears to have permanently impacted the value of the GBP, with the value against the Euro dropping from the 1.30s to the 1.10s. The USD turbulence is more related to political and economic developments within, and outside of, the US.
After almost 14 years, interest rates in the UK have increased significantly, as the Bank of England takes action to reduce inflation from the current rates of 10% to the target level which is below 2%. Whilst the objective is to reduce consumer spending, businesses that raise working capital through borrowing are also facing significant increases in the cost of financing.
Pound Sterling vs. Euro & US dollar in 2022
No Data Found
Following the invasion of Ukraine by Russia, the USD gained strength as there was a market move to what is perceived to be a safe currency. The negative impact of the UK ‘mini budget’ is clearly evidenced in the September performance, with intra-month GBP:Euro falling well below 1.10, although the predictions of sub-parity against the Euro and USD were never realised. Most recently the USD has weakened as concerns grow about a slowdown in the US economy.
Exchange Rates – 2016 – 2022
No Data Found
The result of the June 2016 Brexit referendum appears to have permanently impacted the value of the GBP, with the value against the Euro dropping from the 1.30’s to the 1.10’s.
The USD turbulence is more related to political and economic developments within, and outside of, the US.
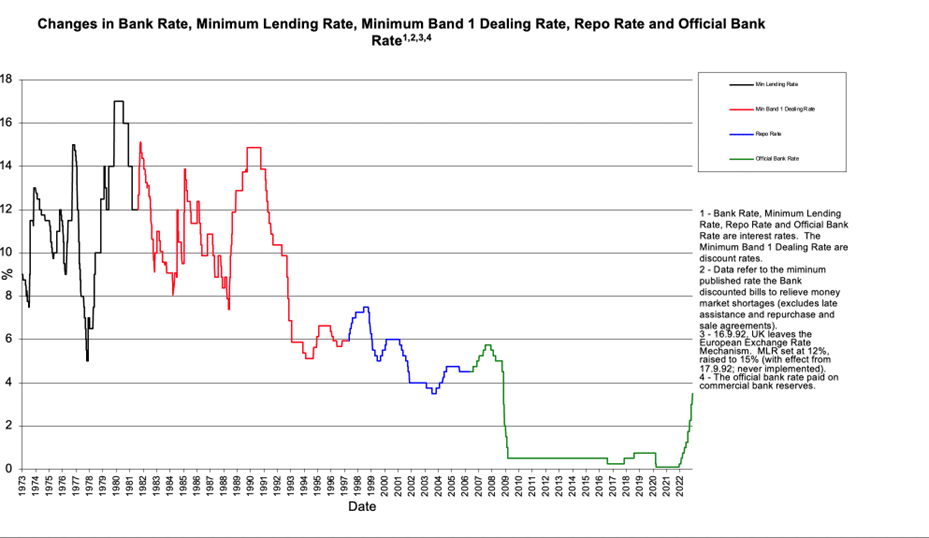
(Source Bank of England https://www.bankofengland.co.uk/monetary-policy/the-interest-rate-bank-rate)
After almost 14 years, interest rates in the UK have increased significantly, as the Bank of England takes action to reduce inflation from the current rates of 10% to the target level which is below 2%.
Whilst the objective is to reduce consumer spending, businesses who raise working capital through borrowing are also facing significant increases in the cost of financing.
Crude Oil
Crude Oil prices are often regarded as a proxy for the global economic outlook and following a long-term recovery from the low point that ensued from the Covid-19 pandemic hitting the Western World in April 2020, prices have been falling since mid-2022 as concerns about global economic growth continue to mount.
Crude Oil Prices
No Data Found
Feedstock
The volatility of aromatic feedstock continued in 2022, with both Benzene and Styrene monomers recording large swings, which were almost entirely independent of Brent Crude and Naphtha.
No Data Found
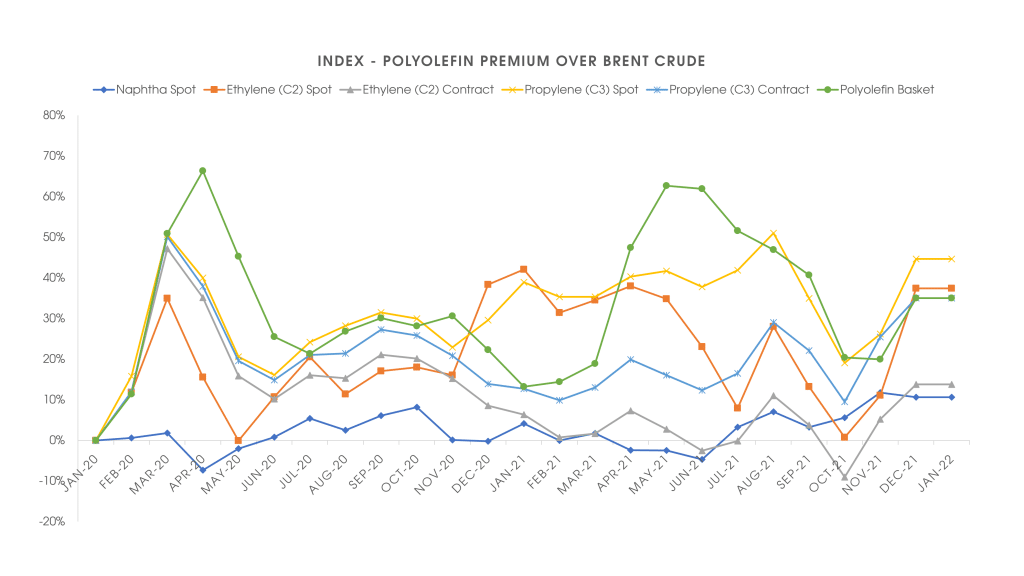
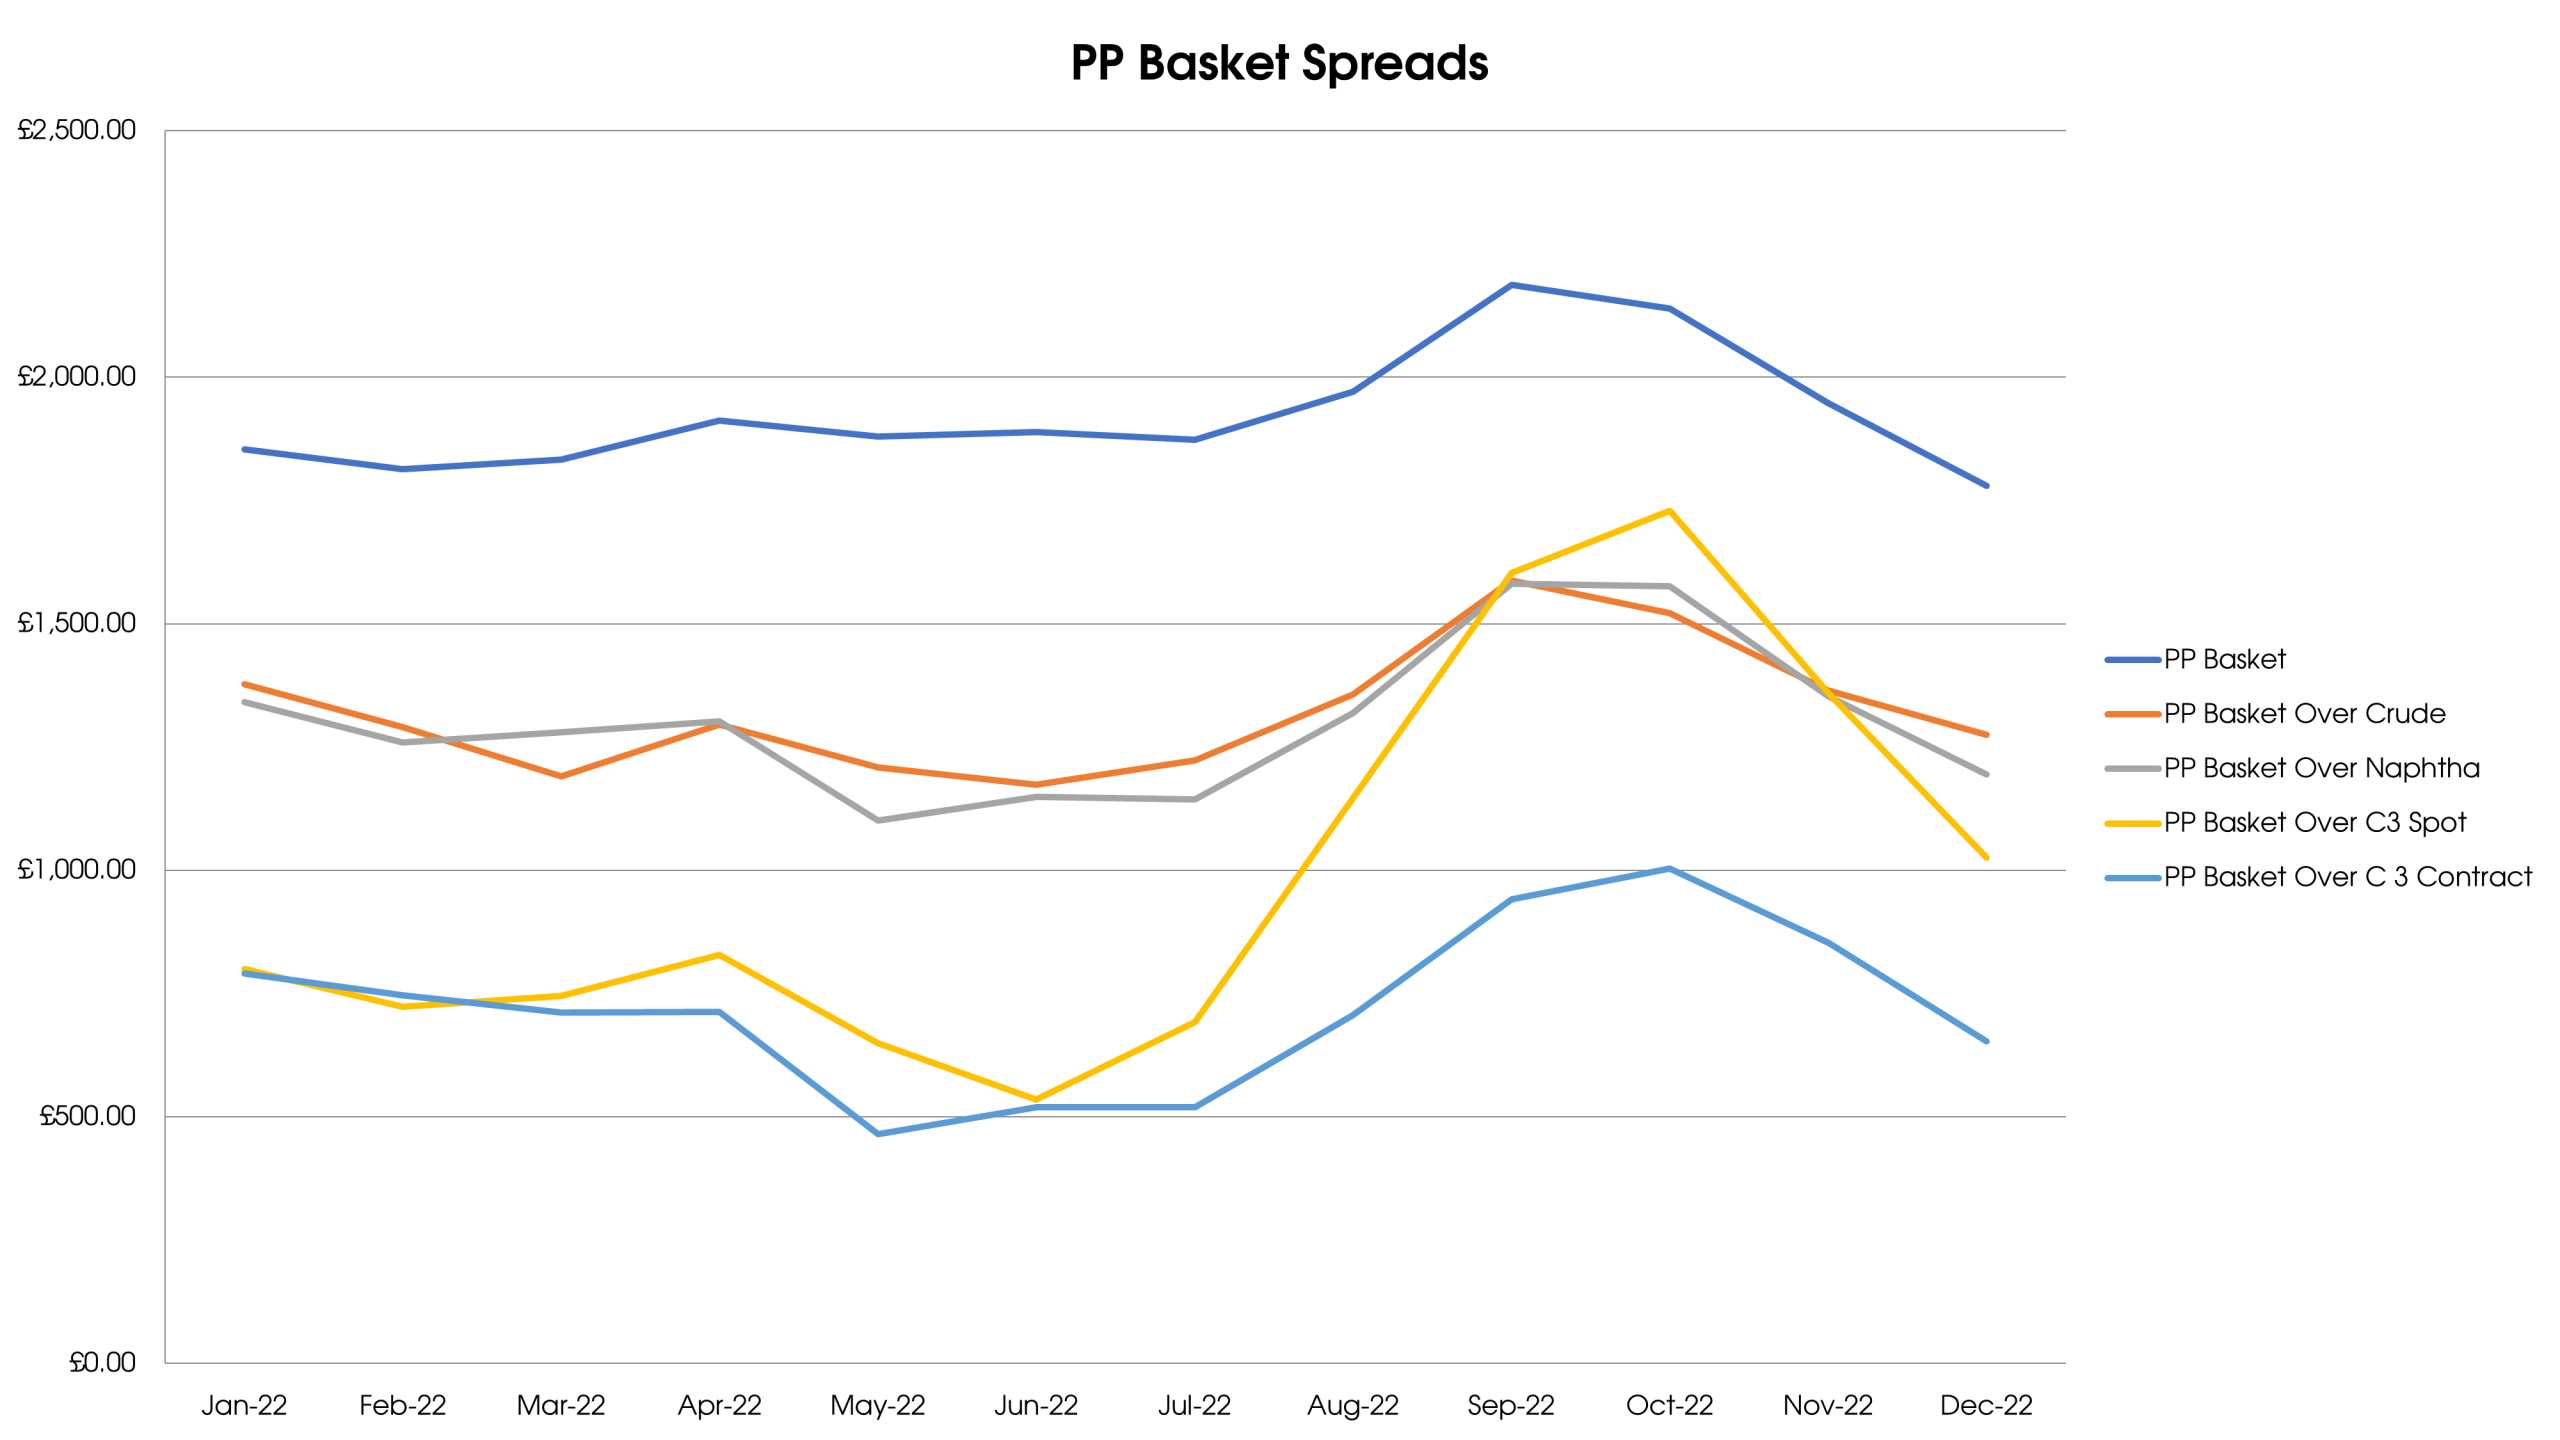
In terms of olefins and to some extent Naphtha, the market situation was quite unusual, in that a strong recovery in demand for transport fuels coupled with supply restrictions of refined products from Russia resulted in refineries operating at exceptionally high rates. Furthermore, the high demand for refined fuels from Europe resulted in exceptionally high refinery margins, which could easily be observed through the persistently high retail prices for petrol and diesel at a time when crude oil prices were moderating.
Since petrochemical feedstocks are typically a by-product of crude oil refining, supply significantly exceeded demand and hence prices fell. This phenomenon was especially apparent in the case of the C3 (Propylene) spot price because the FCC (Fluidised Catalytic Cracker) used in the petrol refining process results in significant C3 and hence the C3 spot price falling below the crude oil price in September as C3 molecules desperately sought buyers so that the refineries could continue to operate and cash in on the high margins for fuels. Towards the end of 2022, the retail price of petrol and diesel started to fall, suggesting that supply and demand are starting to become more balanced.
The table below demonstrates that all monomers were discounted in 2022, and the relative reduction in C3 compared to C2 is further evidence of the excess supply outlined above. Nonetheless, all monomers have recorded a significant net gain over the two years and the economics of monomer production remain attractive.
| C2 | C3 | SM | Benzene | |
| Jan 2021 | 65.00 | 65.00 | 108.00 | 165.00 |
| Feb 2021 | 70.00 | 85.00 | 24.00 | (84.00) |
| Mar 2021 | 75.00 | 85.00 | 501.00 | 163.00 |
| Apr 2021 | 40.00 | 45.00 | 312.00 | 230.00 |
| May2021 | 5.00 | 10.00 | 87.00 | 369.00 |
| Jun 2021 | 30.00 | 40.00 | (401.00) | (480.00) |
| Jul 2021 | 40.00 | 50.00 | (207.00) | (68.00) |
| Aug 2021 | 53.00 | 58.00 | 35.00 | 101.00 |
| Sep 2021 | (8.00) | (5.00) | (91.00) | (81.00) |
| Oct 2021 | 25.00 | 25.00 | 23.00 | (56.00) |
| Nov 2021 | 92.50 | 95.00 | 232.00 | 58.00 |
| Dec 2021 | (10.00) | 0.00 | 23.00 | 22.00 |
| Jan 2021 | 0.00 | 0.00 | 119.00 | 209.00 |
| Feb 2021 | 67.50 | 67.00 | (51.00) | (85.00) |
| Mar 2021 | 95.00 | 95.00 | 93.00 | 20.00 |
| Apr 2021 | 230.00 | 225.00 | 360.00 | 48.00 |
| May2021 | (70.00) | (65.00) | 84.00 | 45.00 |
| Jun 2021 | 0.00 | (10.00) | 16.00 | 297.00 |
| Jul2021 | (100.00) | (120.00) | 155.00 | 386.00 |
| Aug 2021 | (70.00) | (85.00) | (509.00) | (663.00) |
| Sep 2021 | (120.00) | (165.00) | (287.00) | (318.00) |
| Oct 2021 | (45.00) | (50.00) | 9.00 | 22.00 |
| Nov 2021 | 35.00 | 20.00 | 4.00 | 42.00 |
| Dec 2021 | (25.00) | (30.00) | (132.00) | (196.00) |
| Cumlative 2020 | 477.50 | 553.00 | 646.00 | 339.00 |
| Cumlative 2021 | (2.50) | (118.00) | (139.00) | (193.00) |
| Sum | 475.00 | 435.00 | 507.00 | 146.00 |
The passing through of monomer price adjustments to polymer prices remained a matter of serious contention between buyers and sellers. In attempts to recover increased energy costs polymer producers sought to discount reductions but to pass any increases on in full and in some cases applied energy surcharges. Ultimately, the level of reductions was a reflection of the market with plastic processors typically enjoying the full reductions as producers continued to chase volumes, even despite their best efforts to balance the market through reduced operating rates.
The graph below clearly confirms through spot pricing the over-supply of C2 and C3, which were effectively cross-subsidised by the high margins resulting from refining transport fuels.
PVC – Suspension & Emulsion
In the case of PVC, the production of Chlorine is a critical component of the economics and here the cost of electricity for the electrolysis process is of great significance. Furthermore, the by-product of Chlorine production is Caustic Soda which is used in the production of Aluminium from Bauxite, therefore the price of this commodity is also critical.
Emulsion grade PVC is a more specialist material and as such can achieve significant margins over and above the highly commoditised suspension grades of PVC. The additional cost of energy in Europe has led to significant import penetration from the USA, which is sufficiently advantaged in terms of energy and ethylene costs to overcome the barrier of 6% import duty and any additional logistics costs.
PVC Feedstocks
No Data Found
E-PVC Pastes
| Min | Max | Average | Range | GBP Volatilty | Euro Volatilty |
2013 | £1,182.53 | £1,245.98 | £1,211.52 | £63.45 | 5% | 2% |
2014 | £1,053.88 | £1,183.06 | £1,131.99 | £129.18 | 11% | 7% |
2015 | £924.37 | £1,081.70 | £1,014.87 | £157.33 | 16% | 18% |
2016 | £1,063.39 | £1,309.40 | £1,179.25 | £246.01 | 21% | 6% |
2017 | £1,280.54 | £1,380.30 | £1,340.19 | £99.76 | 7% | 4% |
2018 | £1,363.18 | £1,429.79 | £1,396.01 | £66.61 | 5% | 4% |
2019 | £1,274.66 | £1,395.72 | £1,349.84 | £121.06 | 9% | 3% |
2020 | £1,204.08 | £1,470.94 | £1,314.26 | £266.86 | 20% | 18% |
2021 | £1,481.39 | £2,148.49 | £1,814.32 | £667.10 | 37% | 41% |
2022 | £2,109.76 | £2,431.12 | £2,279.79 | £321.36 | 14% | 18% |
Overall | £924.37 | £2,431.12 | £1,403.20 | £1,506.74 | 107% | 100% |
S-PVC Base
| Min | Max | Average | Range | GBP Volatilty | Euro Volatilty |
2013 | £755.11 | £825.50 | £793.64 | £70.39 | 9% | 10% |
2014 | £679.30 | £794.22 | £757.34 | £114.92 | 15% | 12% |
2015 | £572.07 | £782.79 | £695.58 | £210.72 | 30% | 33% |
2016 | £728.18 | £916.13 | £820.50 | £187.95 | 23% | 10% |
2017 | £898.53 | £1,014.60 | £979.29 | £116.06 | 12% | 9% |
2018 | £994.56 | £1,035.53 | £1,016.97 | £40.97 | 4% | 5% |
2019 | £909.87 | £1,013.85 | £961.18 | £103.98 | 11% | 6% |
2020 | £844.85 | £1,126.97 | £961.05 | £282.11 | 29% | 27% |
2021 | £1,153.43 | £1,774.84 | £1,497.47 | £621.40 | 41% | 71% |
2022 | £1,687.81 | £1,998.88 | £1,848.11 | £311.07 | 17% | 20% |
Overall | £572.07 | £1,998.88 | £1,033.11 | £1,426.80 | 138% | 144% |
PET
The dynamics of PET pricing are complex with the following factors all having the potential to significantly impact pricing:
- rPET pricing, the demand for which is rapidly increasing as a combination of pressure from consumers, retailers and brands escalates. These pressures are enhanced by the UK plastics packaging tax, and similar legislation that is being implemented in other countries.
- Use of PET in the textiles market, where PET is commonly substituted for natural cotton whenever this crop is scarce, and prices inflated.
- Seasonal demand for carbonated drinks, a market which is heavily influenced by weather conditions, with high temperatures typically increasing demand.
The dominant effect of rPET may go some way to explain why the mid-year escalation in Paraxylene costs were not fully reflected in PET pricing.
PET Feedstocks
No Data Found
Min | Max | Average | Range | GBP Volatilty | Euro Volatilty | |
2011 | £1,213.93 | £1,545.92 | £1,392.55 | £332.00 | 24% | 18% |
2012 | £1,069.13 | £1,323.05 | £1,219.63 | £253.91 | 21% | 16% |
2013 | £1,123.82 | £1,332.20 | £1,214.17 | £208.38 | 17% | 14% |
2014 | £896.00 | £1,116.88 | £1,010.27 | £220.88 | 22% | 17% |
2015 | £798.80 | £952.14 | £856.39 | £153.33 | 18% | 58% |
2016 | £809.76 | £934.01 | £886.66 | £124.25 | 14% | 66% |
2017 | £1,002.64 | £1,133.43 | £1,062.24 | £130.79 | 12% | 9% |
2018 | £1,045.54 | £1,321.66 | £1,187.85 | £276.12 | 23% | 22% |
2019 | £899.26 | £1,122.92 | £1,038.44 | £223.65 | 22% | 19% |
2020 | £833.03 | £918.94 | £866.19 | £85.91 | 10% | 15% |
2021 | £910.25 | £1,392.69 | £1,177.68 | £482.44 | 41% | 45% |
2022 | £1,277.37 | £1,612.99 | £1,456.25 | £335.62 | 23% | 27% |
Overall | £798.80 | £1,612.99 | £1,114.03 | £814.19 | 73% | 76% |
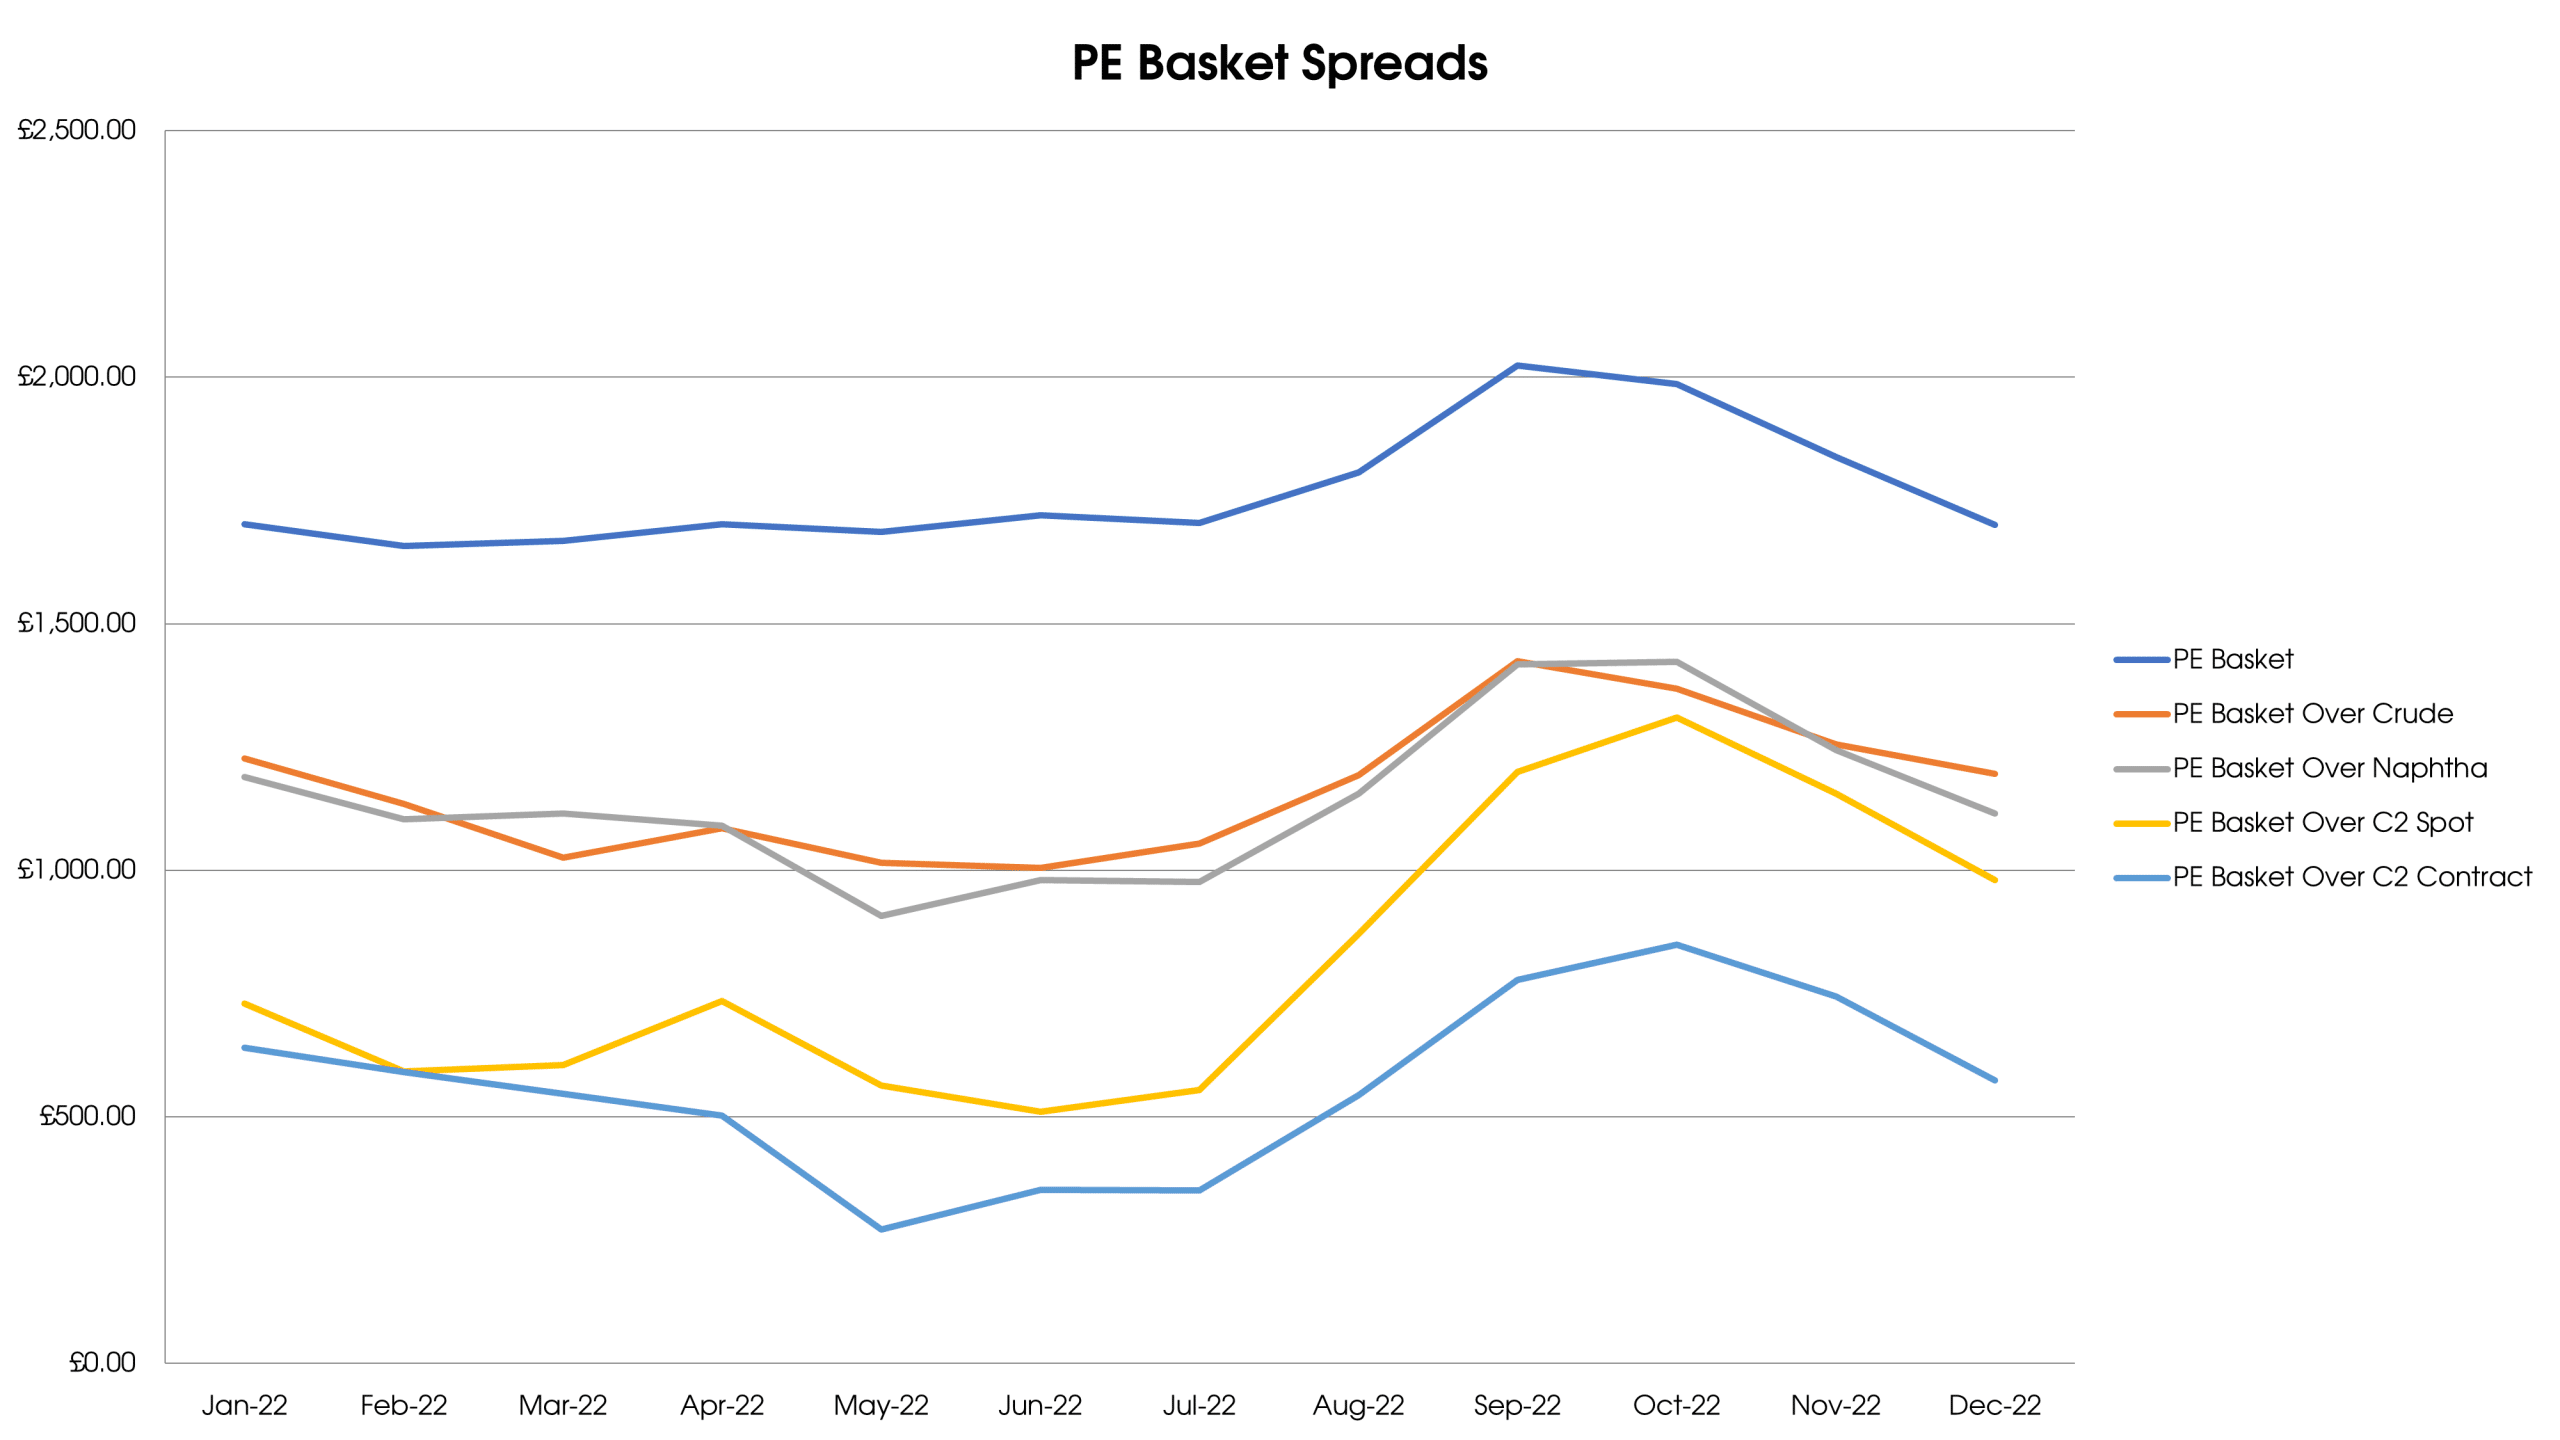
Polyolefins
2022 was a tale of two halves, with already high prices, escalating to record highs in September, before prices rapidly fell away. The negative market sentiment was driven by oversupply in a market where demand fell significantly, and even despite the efforts of polymer producers to curb output rates prices continued to drop on the back of oversupply.
Polyolefins Feedstocks
No Data Found
Polypropylene has traded at a discount to polyethylene throughout 2022 and is a combination of factors including:
- A relative reduction in the C3 price compared to the C2 price
- PP producers taking advantage of the low C3 spot pricing
- Lower production and/or demand for consumer durables such as cars and white goods for which PP is a much more significant component than PE
In the course of 2022, the supply of PE from the USA resumed, following a period of restricted supply in 2021, and towards the end of the year significant volumes of C4 and C6 LLDPE for film applications and HDPE for blow moulding were physically present in the UK market, and as mentioned above these materials have substituted the volumes from Russia that have now disappeared from the market.
| Min | Max | Average | Range | GBP Volatilty | Euro Volatilty | |
| 2011 | £1,083.86 | £1,254.28 | £1,254.28 | £170.42 | 14% | 19% |
| 2012 | £996.99 | £1,296.36 | £1,190.35 | £299.38 | 25% | 24% |
| 2013 | £1,178.07 | £1,312.98 | £1,252.85 | £134.91 | 11% | 10% |
| 2014 | £1,075.70 | £1,251.19 | £1,182.12 | £175.50 | 14% | 11% |
| 2015 | £879.41 | £1,247.39 | £1,088.53 | £367.98 | 34% | 36% |
| 2016 | £1,071.30 | £1,239.74 | £1,157.95 | £168.44 | 15% | 7% |
| 2017 | £1,174.96 | £1,289.37 | £1,247.21 | £114.41 | 9% | 9% |
| 2018 | £1,231.36 | £1,303.88 | £1,266.78 | £72.51 | 6% | 7% |
| 2019 | £1,083.50 | £1,266.89 | £1,174.44 | £183.39 | 16% | 10% |
| 2020 | £978.78 | £1,144.82 | £1,072.74 | £166.04 | 15% | 14% |
| 2021 | £1,128.83 | £1,868.60 | £1,628.61 | £739.78 | 45% | 80% |
| 2022 | £1,545.91 | £2,074.12 | £1,765.68 | £528.21 | 31% | 52% |
| Overall | £879.41 | £2,074.12 | £1,273.46 | £1,194.71 | 71% | 80% |
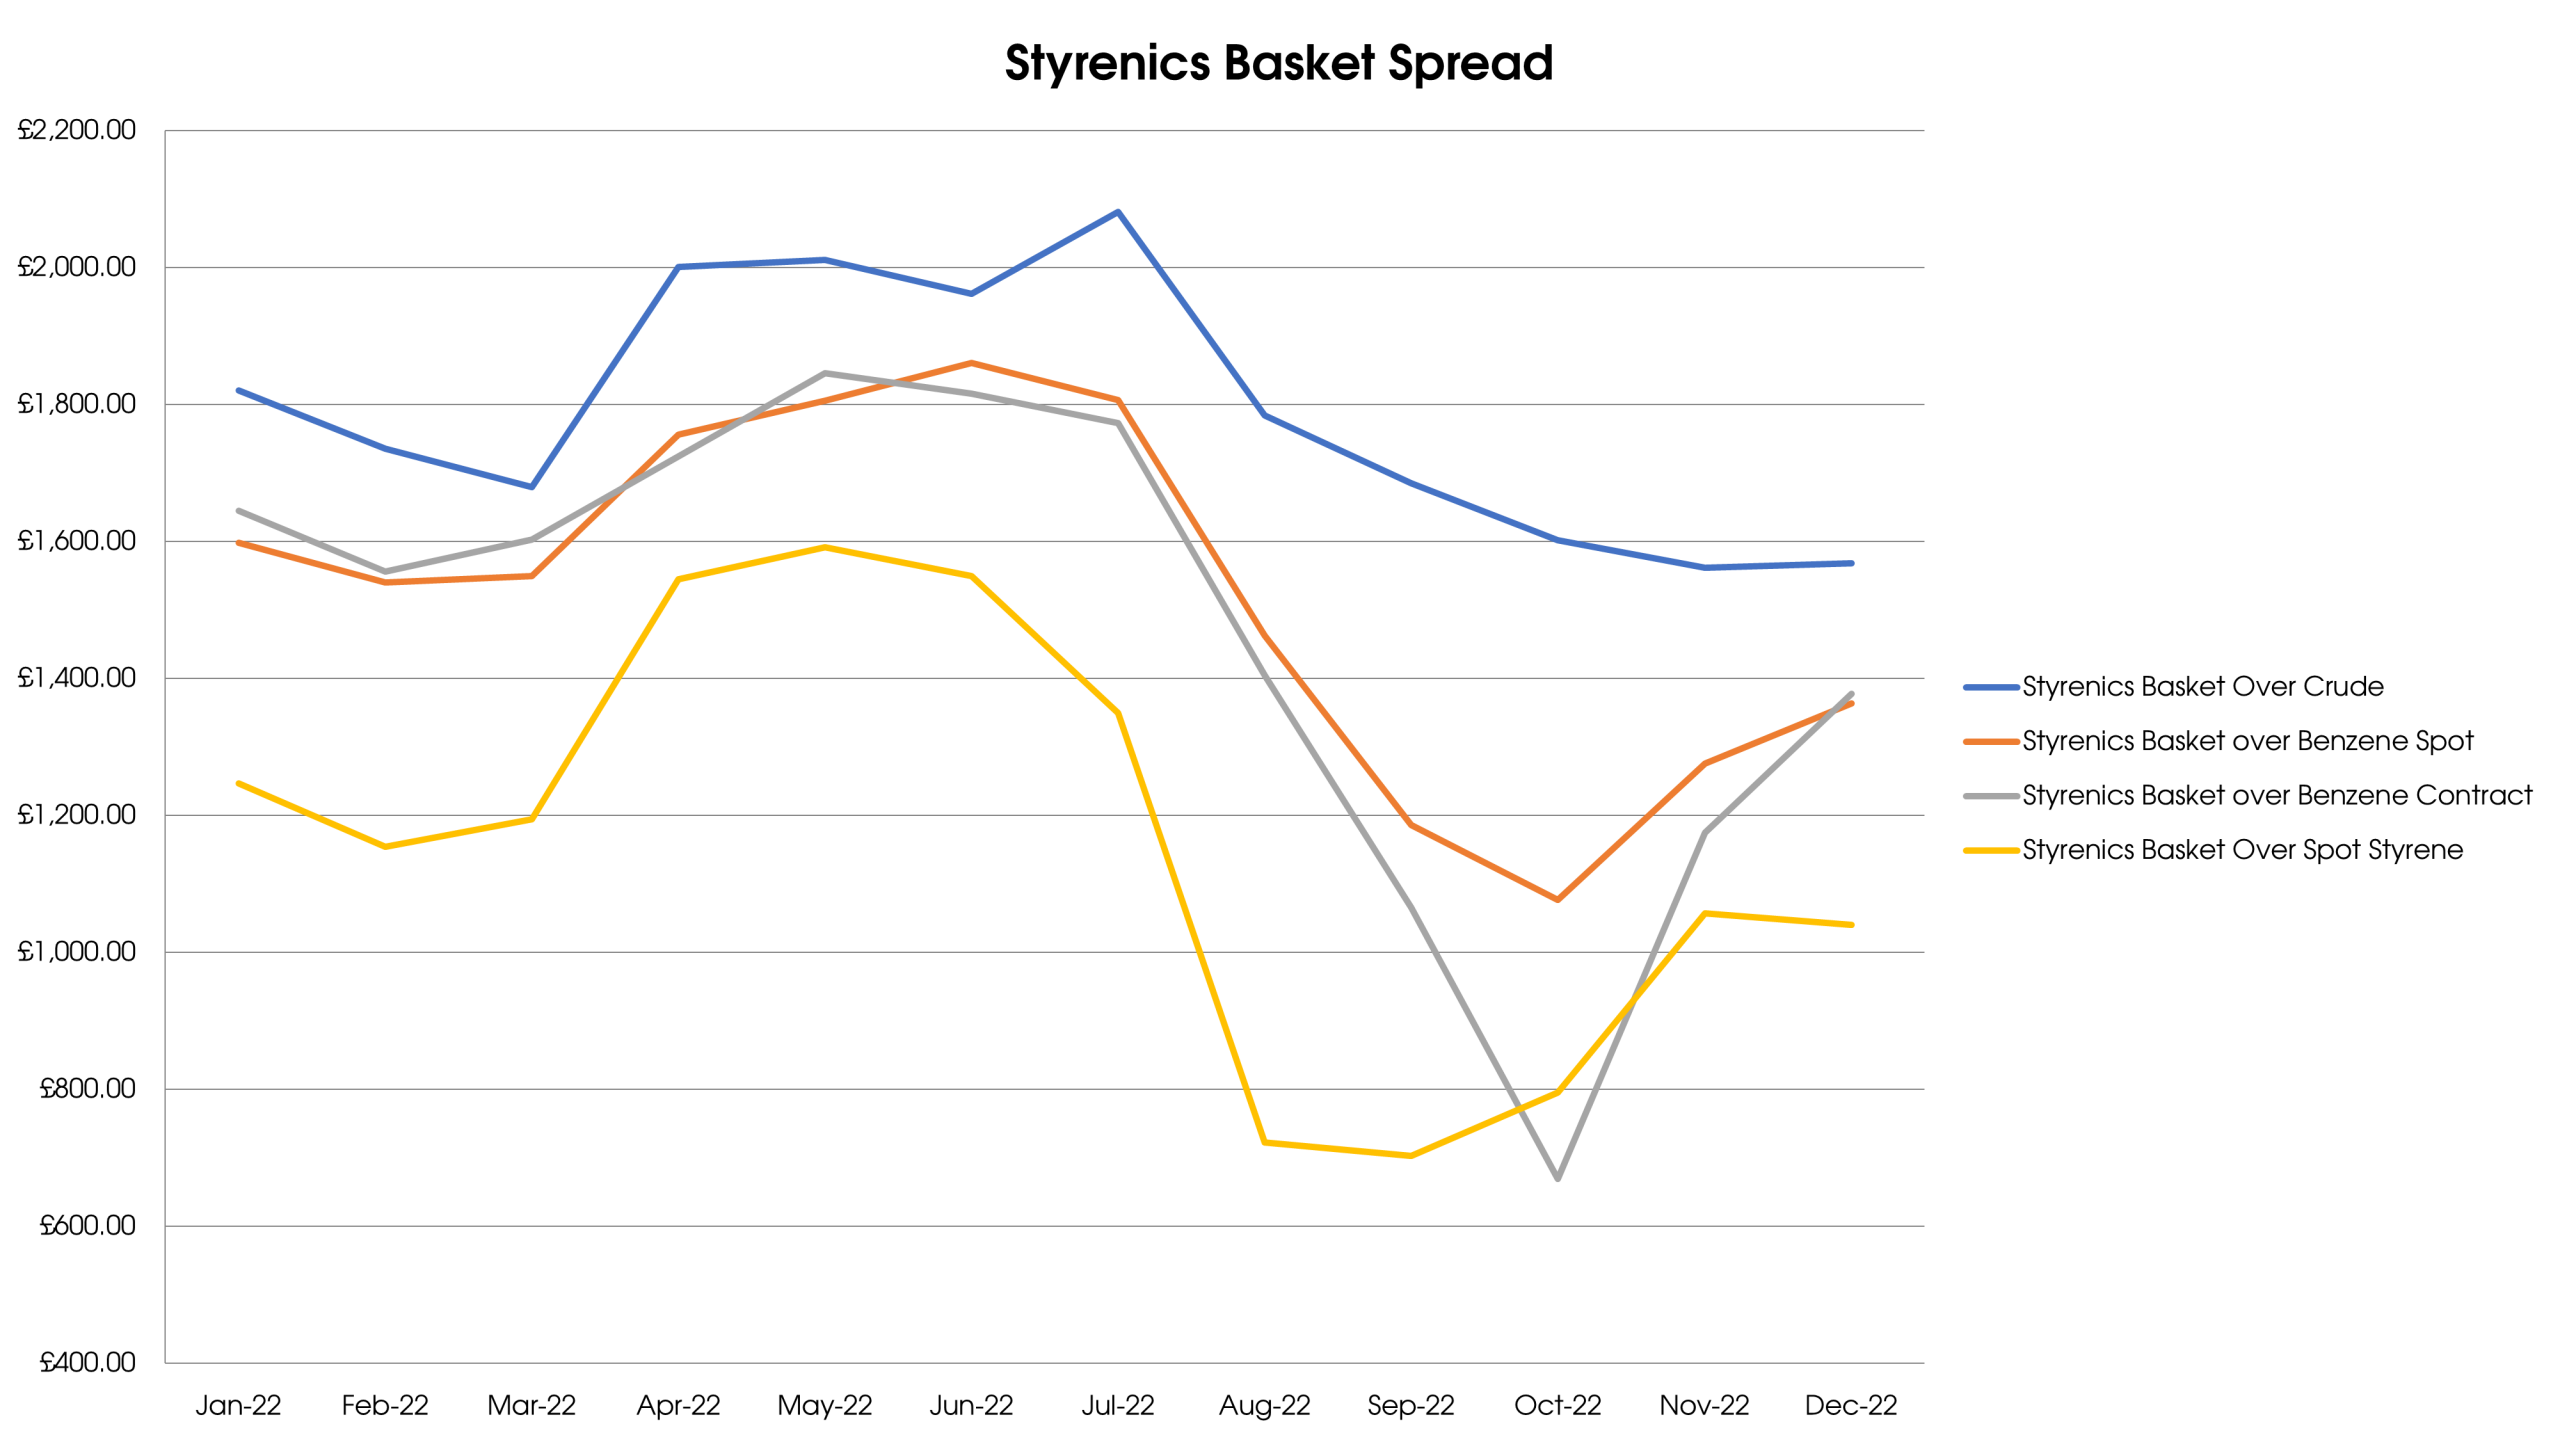
Styrenics
As in the prior year, the volatility of aromatic feedstock costs was a key factor in the economics of the production of styrene-based polymers. In addition, volumes from Asia were constrained for much of the year as a result of the high shipping costs. The softening of prices after the summer is a reflection of demand in Asia, the reduction in shipping costs and some dramatic falls in feedstock costs.
The year ended with the shocking announcement that Trinseo would discontinue styrene production at its Böhlen site in Saxony, Germany due to poor economics and a failure to find a buyer for the business. The closure will remove 300kTonnes of European capacity and will have a significant impact on the supply demand balance.
Styrenics Feedstocks
No Data Found
| Min | Max | Average | Range | GBP Volatilty | Euro Volatilty | |
| 2011 | £1,455.41 | £1,738.32 | £1,622.02 | £282.91 | 17% | 11% |
| 2012 | £1,452.41 | £1,642.55 | £1,578.63 | £190.15 | 12% | 10% |
| 2013 | £1,671.73 | £1,797.07 | £1,735.75 | £125.34 | 7% | 7% |
| 2014 | £1,476.79 | £1,676.77 | £1,606.53 | £199.99 | 12% | 8% |
| 2015 | £1,225.39 | £1,499.12 | £1,362.43 | £273.73 | 20% | 23% |
| 2016 | £1,337.20 | £1,637.95 | £1,508.17 | £300.75 | 20% | 11% |
| 2017 | £1,688.91 | £2,024.70 | £1,821.47 | £335.79 | 18% | 17% |
| 2018 | £1,674.44 | £1,947.98 | £1,845.19 | £273.53 | 15% | 17% |
| 2019 | £1,470.71 | £1,689.42 | £1,613.05 | £218.71 | 14% | 13% |
| 2020 | £1,330.68 | £1,654.70 | £1,466.38 | £324.02 | 22% | 20% |
| 2021 | £1,760.01 | £2,420.25 | £2,100.55 | £660.24 | 31% | 34% |
| 2022 | £2,073.08 | £2,731.88 | £2,392.41 | £658.80 | 28% | 30% |
| Overall | £1,225.39 | £2,731.88 | £1,707.91 | £1,506.49 | 31% | 34% |
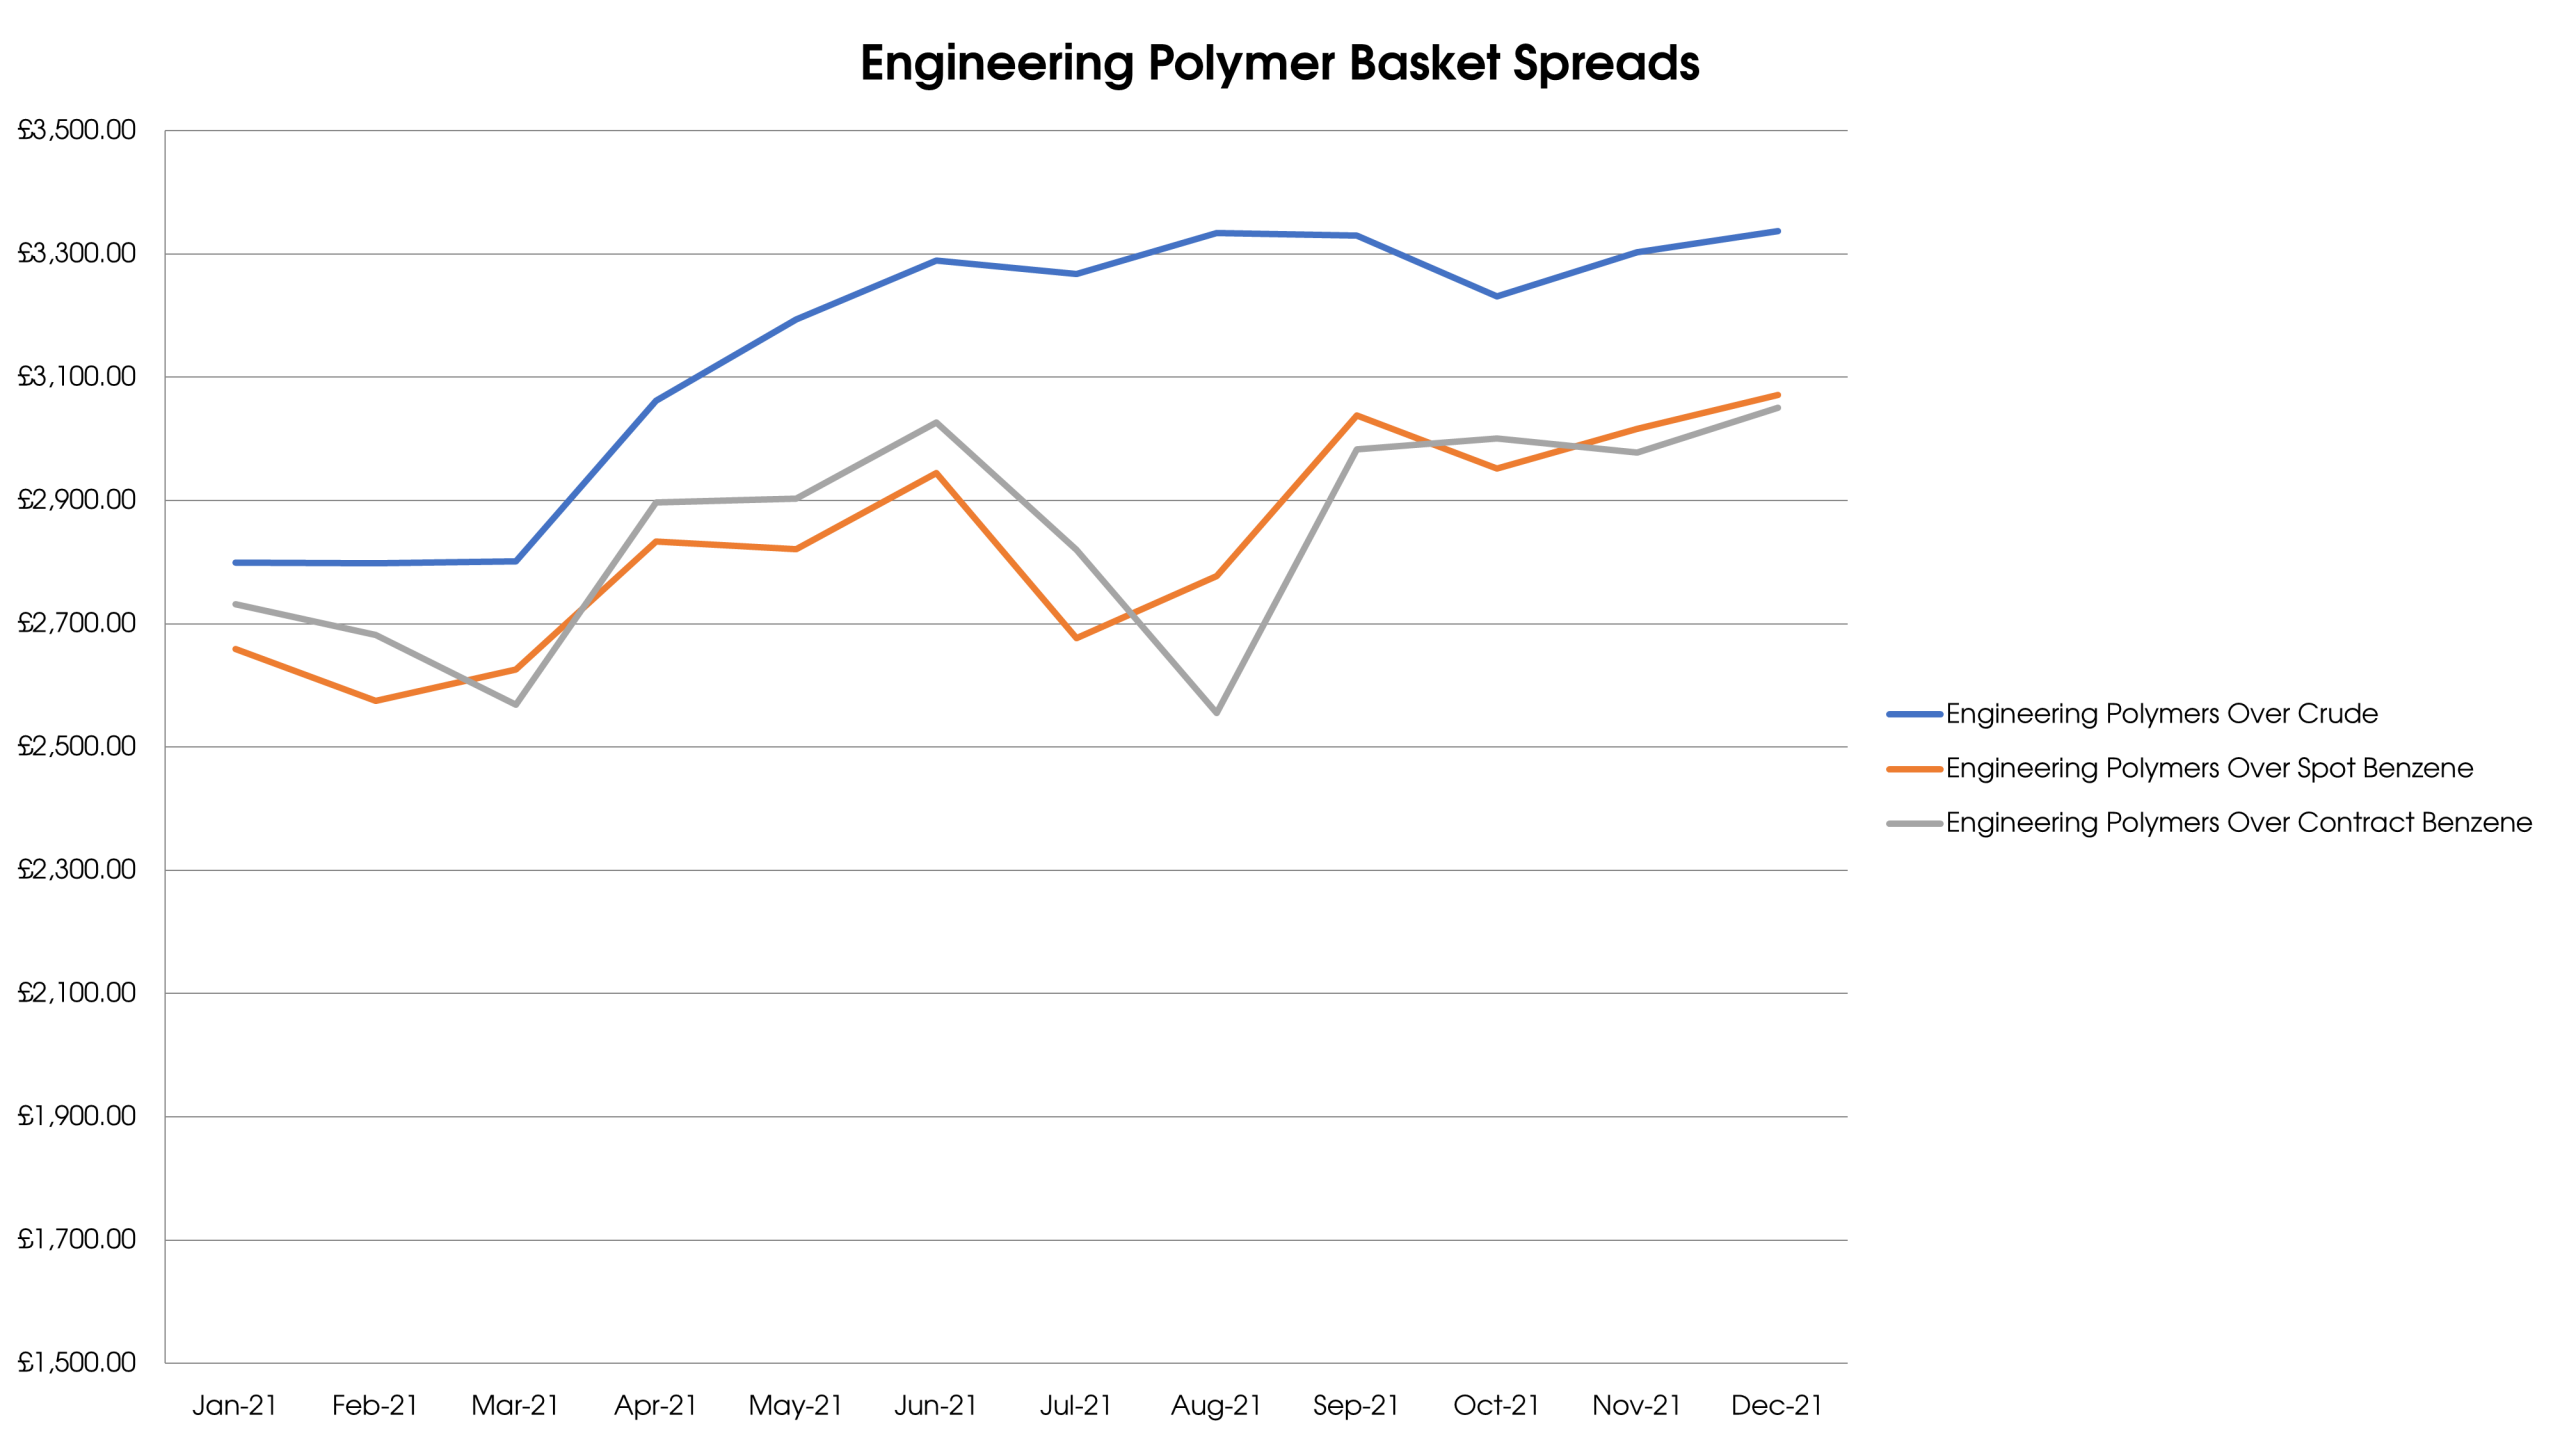
Engineering Polymers
The engineering polymers market very much reflected the broader economic situation; up until about the mid-year point supply for most grades was limited and demand from most sectors, apart from automotive, quite robust. However, the realities of a global economic slowdown coupled with falling East-West shipping rates started to put prices under pressure from September onwards.
The non-integrated nature of engineering polymer production enabled producers to recover margins after a dip in the summer months that was related to the volatility of aromatic feedstocks, however energy input costs will also be a matter of concern with the relocation of some base resin production for PBT compounds being relocated to Asia on economic grounds.
Trinseo announce that in addition to closing SM (styrene monomer) capacity, that it would also shutter one of its two production lines for polycarbonate in Stade, Germany, citing over-capacity and poor economics as the rationale for this decision.
No Data Found
| Min | Max | Average | Range | GBP Volatilty | Euro Volatility | |
| 2011 | £2,797.47 | £3,125.71 | £2,992.91 | £328.24 | 11% | 8% |
| 2012 | £2,709.19 | £2,821.57 | £2,759.92 | £112.38 | 4% | 3% |
| 2013 | £2,806.99 | £2,911.74 | £2,864.60 | £104.74 | 4% | 2% |
| 2014 | £2,653.57 | £2,798.40 | £2,798.40 | £144.83 | 5% | 3% |
| 2015 | £2,336.07 | £2,549.00 | £2,406.03 | £212.93 | 9% | 2% |
| 2016 | £2,474.80 | £2,886.83 | £2,653.97 | £412.03 | 16% | 2% |
| 2017 | £2,803.68 | £3,223.95 | £3,054.98 | £420.27 | 14% | 19% |
| 2018 | £3,235.48 | £3,409.01 | £3,328.41 | £173.53 | 5% | 5% |
| 2019 | £2,942.34 | £3,276.32 | £3,153.67 | £333.98 | 11% | 8% |
| 2020 | £2,908.67 | £3,098.01 | £3,027.08 | £189.34 | 6% | 4% |
| 2021 | £3,104.82 | £3,760.12 | £3,533.57 | £655.30 | 19% | 18% |
| 2022 | £3,697.17 | £4,403.93 | £2,977.07 | £706.76 | 24% | 21% |
| Overall | £2,336.07 | £4,403.93 | £3,060.19 | £2,067.85 | 24% | 21% |
2023 Outlook
UK Economic Outlook
Even before any mention of recession, most economists were already predicting that the UK would have the lowest rate of growth in the G7 due to the negative impacts of Brexit on trade. A global economic slowdown and rampant inflation will put further pressure on the UK economy, and higher interest rates will have a significant impact on the housing sector in which transaction volumes are expected to fall, but the prospect of falling average house prices will also significantly dent consumer confidence.
Whilst a UK economic slowdown may be more likely to affect services including leisure and entertainment, businesses will face significant cost pressures from factors including fixed and variable cost inflation, higher finance costs and an increase in the rate of corporation tax from 19% to 25%.
The UK Government continues to review the UK REACh legislation and has extended the deadlines for the full registration and announced that it will enter into discussion with regards to the need to closely follow EU REACh, or to take a different approach.
Global Geopolitical Issues
A rapid resolution of the Russian intention to invade Ukraine looks to be highly unlikely, and with this comes the prospect of increased tensions between East and West, although China appears to be resisting calls from President Putin to become more involved in the conflict.
The protracted withdrawal Russian origin crude oil, natural gas, refined products and petrochemical derivatives has resulted in a jump in prices for many these essential commodities, and substitution with products from alternative origins will continue to require significant investment in infrastructure and resources, which in turn will have long-term consequences for price levels which are now likely to remain elevated into the long-term.
Logistics
The extreme spike in international shipping cost in 2022 is unlikely to recur in the foreseeable future, and as such the movement of polymers around the globe will not be subject to any prohibitive premiums. There remains the possibility that container shortages could recur if Covid-19 results in significant issues for the Chinese economy, or if the economic slowdown in the West results in slower turnarounds of shipping containers. Since the crisis last year, more shipping capacity is now on-stream and additional containers introduced.
On the domestic front the issue with a shortage of HGV drivers appears to have eased, and even in the final quarter of 2022 when seasonal demand is high, there were no significant issues.
Further logistics cost inflation will take place in 2023, as providers look to recover cost increases and improve profitability. Inevitably these costs will be passed through the entire supply chain, and in part are an important factor in retail inflation.
Exchange Rates
Relative prospects for the UK economy are likely to dominate exchange rates throughout 2023. Whilst USD:GBP exchange rates are a typical reference, the perceived weaking of the US economy means that referencing against more stable currencies such as the Euro and JPY is likely to give a more accurate reflection of the views of the international markets on the value of the GBP.
With more stable domestic politics, there should be less volatility with exchange rates and it is expected that the GBP:Euro will continue to trade a similar levels throughout 2023.
Crude Oil
The likely scenario is that Brent Crude will continue to trade in the 70 – 90 USD per barrel range, with energy companies trying hard to manage supply in an economic environment that will tend towards falling prices, in an effort to stabilise the slowdown that is taking place.
It is notable that many traditional energy companies that have been heavily reliant on Crude Oil sales, have increasingly diversified their sources of revenue, with many now turning more to renewables for sustainability both of the planet and for their business models.
Many energy companies also benefit from significant natural gas revenues, and until recently this has been a major source of profitability as prices have spiked on the back of supply restrictions from Russia.
Feedstock
VCM (Vinyl Chloride Monomer)
Energy costs and price/demand for Caustic Soda will have a significant bearing on VCM economics, along with the price of C2. A further slowdown in the US economy and in particular the construction sector is likely to result in increased imports of S-PVC resin which will tend to cap monomer pricing.
PX (Paraxylene)
rPET pricing is expected to have a significant influence on PX costs, and the different economic structure of r-PET has the ability to cap prime virgin PET pricing and therefore also impact PX pricing. External factors such as demand for fibre applications, along with weather conditions will also be of influence in terms of the supply demand balance. An increasing trend towards rPET is likely to push PX towards a surplus of supply and therefore softer prices.
C2 (Ethylene)
Ethylene pricing is likely to be heavily influenced by the level of PE imports from the USA, which started to resume in 2022. With the expectation that US imports will further increase, as new capacities come on stream, it is likely that local demand for C2 within Europe will be suppressed. If this proves to be the case then the likelihood is that ethylene prices will decline, which along with competitively priced PE US imports will tend to cap European PE prices at similar levels to the end of 2022.
C3 (Propylene)
C3 has a double reliance on crude oil refining in which C3 is a significant co-output of Naphtha cracking for ethylene and also a biproduct of the FCC (Fluidised Catalytic Cracking) process used to upgrade the petroleum fraction of crude oil distillate to the required environmental standards. Whilst the ratio of C2 to C3 in the Naphtha cracking process can be adjusted, this is within a relatively narrow window and therefore low C2 demand along with refinery output rates will impact C3 availability. The oversupply of C3 in 2022 was not expected, and largely came as a result of the absence of Russian origin refined fuels in the European market. Given that demand consumer durables which can include significant amounts of PP, including white goods and cars, will be low then it is likely that C3 prices will remain suppressed.
Benzene
This is an important aromatic hydrocarbon compound which is the basis for the following intermediates including:
- Ethylbenzene
- Cumene
- Cyclohexane
- Nitrobenzene
- Linear Alkylbenzene
- Maleic Anhydride
- Others
Of which Ethylbenzene, Cumene and Cyclohexane are precursors to key monomers including SM (Styrene based polymers), Bisphenol A (PC) and HMXDA (PA66)
Price volatility is expected to continue, particularly as petrochemical producers seek to improve the economics of this important aromatic petrochemical compound.
Styrene Monomer (SM)
The fortunes of SM are closely related to Ethylbenzene and in turn Benzene. An important characteristic of SM and the Benzene family is the relative ease with which these products can be shipped around the world in tanker vessels, and this tends to increase volatility as material is either distressed in the case of surplus and exported or imported in the case of shortage.
SM is also a derivative of Propylene Oxide synthesis which is an important component of polyurethane manufacture, demand for which is currently curtailed by suppressed demand from the automotive sector, which is a key market for polyurethane.
PVC Suspension & Emulsion
Consumption of S-PVC is highly dependent upon the construction sector with the expectation of a slowdown in the global economy then demand is expected to be weak and therefore the downward pressure on pricing expected to continue.
E-PVC is a more speciality product, with a limited number of producers and on this basis the premiums over feedstock costs are likely to be maintained.
PET
Virgin PET prices are likely to remain under pressure as the demand for rPET continues to increase. The availability of feedstock, coupled with the ease with which PET can be recycled, properties upgraded and suitability for food applications is driving the popularity of this material.
Polyolefins
2023 will continue to be challenging for Polyolefins as new capacity for all grades comes on stream and demand is not expected to match it. Highly commoditised grades such as high melt PPHP, HDPE for blow moulding and LLDPE C4/C6 for film applications will be under the most pressure. Oversupply in these sectors will push producers to increase output of more specialised grades which will bring downward price pressure in these more premium products
Styrenics
The situation for 2023 starts with a similar level of uncertainty surrounding the impact of higher energy, and raw material costs and this is likely to be most focused around the more volatile materials such as PS. That said, for most of the styrenic polymers it is unclear what will happen during this year, with the most likely scenario is that prices will remain low and material plentiful throughout the year.